With new data types, improved imports, error bars, and UI tweaks, Graphs 2.0 beta aims to become the go-to plotting tool for serious Linux data work.
On Linux, one of the best apps for plotting data is called Graphs. It’s free and open source, released under GPLv3 or later.
Data is not just a character played by Brent Spiner. It’s also a way for companies to follow trends, for scientists to plot experiments, for students to pass tests, and teachers to understand how the student body is progressing. Data is so crucial in the modern world that it’s often sold to the highest bidder or (unfortunately) stolen and used for nefarious purposes.
One very important aspect of data is the ability to view it in a form that makes sense. After all, who wants to view columns of comma-separated values? I’ve tried, and it hurts my brain.
Instead, we want to view data in pretty graphs, curves, plots, lines, and colors. By viewing data in such a way, we get a visual representation that is far easier to consume. For that, we need an app.
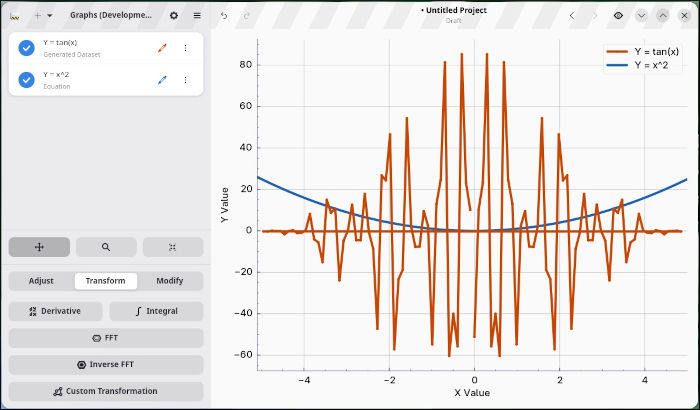
Graphs is a Gnome app, which can also be installed on other desktop environments, that allows you to easily plot and manipulate data. With Graphs, you can import from different file types or generate via equation, manipulate data using a variety of operations (select, cut, translate, multiply, center, and smooth), and apply custom transformations on the data. Graphs supports curve fitting and offers extensive options for the styling of plots.
With Graphs, you can save your plots in a variety of formats that can be shared and/or presented. You can even save a plot as a vector graphic.
What’s New in 2?
The big news is that Graphs is finally going to be updated to version 2. This is big: it’s been two years since the last major update.
“This does not mean that development has stalled; to the contrary,” Graphs’ primary developer, Sjoerd Stendahl, said in an April article announcing the beta release. “But we’ve been working hard on some major changes that took some time to get completely right. Now, after a long development cycle, we’re finally getting close enough to a release to be able to announce an official beta period.”
New features in the upcoming release are many:
- New data types (Datasets, Generated Datasets, and Equations)
- A revamped style editor
- Improved data import
- Error bars
- Singularity handling
- Reworked curve fitting
- UI changes
- Mobile screen support
- Figure exporting
- Drag-and-drop data importing
- Support for base-2 logarithmic scaling
In addition, with the new version you’ll also be able to run multiple instances of Graphs simultaneously, subtitles will display the full file path, inhibiting of a session when unsaved data is open, and more powerful custom transformations.

As I said, this is big. You can get more details about each new feature in Stendahl’s beta announcement.
Installing Graphs
Graphs is installable from Flathub, which makes it very easy to install, as long as your Linux system is Flatpak ready.
Once your system is prepared, install Graphs with the command:
flatpak install flathub se.sjoerd.GraphsWith the app installed, check to see if Graphs appears in your desktop menu. If you don’t find it, log out and log back in, and the launcher should be there.
The above installs the current release, which (as of this writing) is 1.8.8. If you want to install the beta version of 2, follow these steps:
Add the flathub beta remote:
flatpak remote-add --if-not-exists flathub-beta https://flathub.org/beta-repo/flathub-beta.flatpakrepoInstall the application:
flatpak install flathub-beta se.sjoerd.GraphsIf you want to use the beta version by default, issue the following command:
sudo flatpak make-current se.sjoerd.Graphs betaAfter installing the Graphs beta, I noticed that version 1.8.8 was no longer available from my desktop menu. If you depend on Graphs for everyday work, I would suggest installing the beta on a secondary machine or VM, as you don’t want to use beta software on critical data.
Once Graphs is installed, you can start importing your data or begin with a mathematical formula.
Graphs is a powerful tool that helps you plot your data in ways that might not be easy using apps such as LibreOffice. If you need to get serious about your data, you’ll want to give Graphs a try. If you’re anxious to get your hands on the new features, install the beta version, just remember not to depend on it to handle your mission-critical data.
Things I like about Graphs… |
Things I don’t like about Graphs… |
|---|---|
|
|

Jack Wallen is an award-winning writer for TechRepublic, ZDNET, The New Stack, and Linux New Media. He’s covered a variety of topics for over twenty years and is an avid promoter of open source. Jack is also a novelist with over 50 published works of fiction. For more news about Jack Wallen, visit his website.